Prometheus and InfluxDB are powerful time series database monitoring solutions, both of which are natively supported with graphing tool, Grafana.
Setting up these simple but powerful open source tools gives you a great base for monitoring and visualising your systems. We can use agents like node-exporter to publish metrics on remote hosts which Prometheus will scrape, and other tools like collectd which can send metrics to InfluxDB’s collectd listener (as per my post about OpenWRT).

I’m using CentOS 7 on a virtual machine, but this should be similar to other systems.
Install Prometheus
Prometheus is the trickiest to install, as there is no Yum repo available. You can either download the pre-compiled binary or run it in a container, I’ll do the latter.
Install Docker and pull the image (I’ll use Quay instead of Dockerhub).
sudo yum install docker
sudo systemctl start docker
sudo systemctl enable docker
sudo docker pull quay.io/prometheus/prometheus
Let’s create a directory for Prometheus configuration files which we will pass into the container.
sudo mkdir /etc/prometheus.d
Let’s create the core configuration file. This file will set the scraping interval (under global) for Prometheus to pull data from client endpoints and is also where we configure those endpoints (under scrape_configs). As we will enable node-exporter on the monitoring node itself later, let’s add it as a localhost target.
cat << EOF | sudo tee /etc/prometheus.d/prometheus.yml
global:
  scrape_interval:     15s
  evaluation_interval: 15s

scrape_configs:
  - job_name: 'prometheus'
    static_configs:
    - targets: ['localhost:9090']
  - job_name: 'node'
    static_configs:
    - targets:
      - localhost:9100
EOF
Now we can start a persistent container. We’ll pass in the config directory we created earlier but also a dedicated volume so that the database is persistent across updates. We use host networking so that Prometheus can talk to localhost to monitor itself (not required if you want to configure Prometheus to talk to the host’s external IP instead of localhost).
Pass in the path to any custom CA Certificate as a volume (example below) for any end points you require. If you want to run this behind a reverse proxy, then set web.external-url to the hostname and port (leave it off if you don’t).
Note that enabling the admin-api and lifecycle will be allow anyone on your network to perform those functions, so you may want to only allow that if your network is trusted. Else you should probably put those behind an SSL enabled, password protected webserver (out of scope for this post).
Note also that some volumes have either :z or :Z option appended to them, this is to set the SELinux context for the container (shared vs exclusive, respectively).
Also ensure that /etc/pki/tls/certs/ca-bundle.crt is replaced with the actual location of your ca-certs file.
If you need Prometheus to listen on a different port than 9090, then update accordingly.
sudo docker run \
--detach \
--interactive \
--tty \
--network host \
--name prometheus \
--restart always \
--volume prometheus:/prometheus \
--volume /etc/prometheus.d:/etc/prometheus.d:Z \
--volume /etc/pki/tls/certs/ca-bundle.crt:/etc/ssl/certs/ca-certificates.crt:z \
quay.io/prometheus/prometheus \
--config.file=/etc/prometheus.d/prometheus.yml \
--web.external-url=http://$(hostname -f):9090 \
--web.enable-lifecycle \
--web.enable-admin-api \
--web.listen-address=:9090
Check that the container is running properly, it should say that it is ready to receive web requests in the log. You should also be able to browse to the endpoint on port 9090 (you can run queries here, but we’ll use Grafana).
sudo docker ps
sudo docker logs prometheus
Updating Prometheus config
Updating and reloading the config is easy, just edit /etc/prometheus.d/prometheus.yml and restart the container. This is useful when adding new nodes to scrape metrics from.
sudo docker restart prometheus
You can also send a message to Prometheus to reload (if you enabled this by web.enable-lifecycle option).
curl -s -XPOST localhost:9090/-/reload
In the container log (as above) you should see that it has reloaded the config.
Installing Prometheus node exporter
You’ll notice in the Prometheus configuration above we have a job called node and a target for localhost:9100. This is a simple way to start monitoring the monitor node itself! Installing the node exporter in a container is not recommended, so we’ll use the Copr repo and install with Yum.
sudo curl -Lo /etc/yum.repos.d/_copr_ibotty-prometheus-exporters.repo \
https://copr.fedorainfracloud.org/coprs/ibotty/prometheus-exporters/repo/epel-7/ibotty-prometheus-exporters-epel-7.repo

sudo yum install node_exporter
sudo systemctl start node_exporter
sudo systemctl enable node_exporter
It should be listening on port 9100 and Prometheus should start getting metrics from http://localhost:9100/metrics automatically (we’ll see them later with Grafana).
Install InfluxDB
Influxdata provides a yum repository so installation is easy!
cat << \EOF | sudo tee /etc/yum.repos.d/influxdb.repo
[influxdb]
name=InfluxDB
baseurl=https://repos.influxdata.com/centos/$releasever/$basearch/stable
enabled=1
gpgcheck=1
gpgkey=https://repos.influxdata.com/influxdb.key
EOF
sudo yum install influxdb
The defaults are fine, other than enabling collectd support so that other clients can send metrics to InfluxDB. I’ll show you how to use this in another blog post soon.
sudo sed-i 's/^\[\[collectd\]\]/#\[\[collectd\]\]/' /etc/influxdb/influxdb.conf
cat << EOF | sudo tee -a /etc/influxdb/influxdb.conf
[[collectd]]
  enabled = true
  bind-address = ":25826"
  database = "collectd"
  retention-policy = ""
   typesdb = "/usr/local/share/collectd"
   security-level = "none"
EOF
We need to download the types.db from collectd, add a missing metrics for stations and put it in the location specified above.
curl https://raw.githubusercontent.com/collectd/collectd/master/src/types.db
echo "stations value:GAUGE:0:256" >> types.db
sudo mv types.db /usr/local/share/collectd/types.db
This should open a number of ports, including InfluxDB itself on TCP port 8086 and collectd receiver on UDP port 25826. Make sure if you’re running a firewall to open UDP port 25826 in order to receive data across the network.
sudo ss -ltunp |egrep "8086|25826"
Create InfluxDB collectd database
Finally, we need to connect to InfluxDB and create the collectd database. Just run the influx command.
influx
And at the prompt, create the database and exit.
CREATE DATABASE collectd
exit
Install Grafana
Grafana has a Yum repository so it’s also pretty trivial to install.
cat << EOF | sudo tee /etc/yum.repos.d/grafana.repo
[grafana]
name=Grafana
baseurl=https://packages.grafana.com/oss/rpm
enabled=1
gpgcheck=1
gpgkey=https://packages.grafana.com/gpg.key
EOF
sudo yum install grafana
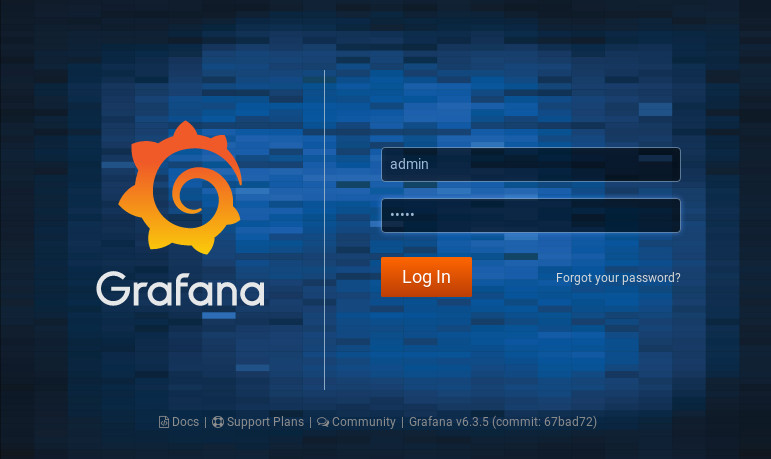
Grafana pretty much works out of the box and can be configured via the web interface, so simply start and enable it. The server listens on port 3000 and the default username is admin with password admin.
sudo systemctl start grafana
sudo systemctl enable grafana-server
sudo ss -ltnp |grep 3000
Now you’re ready to log into Grafana!
Configuring Grafana
Browse to the IP of your monitoring host on port 3000 and log into Grafana.
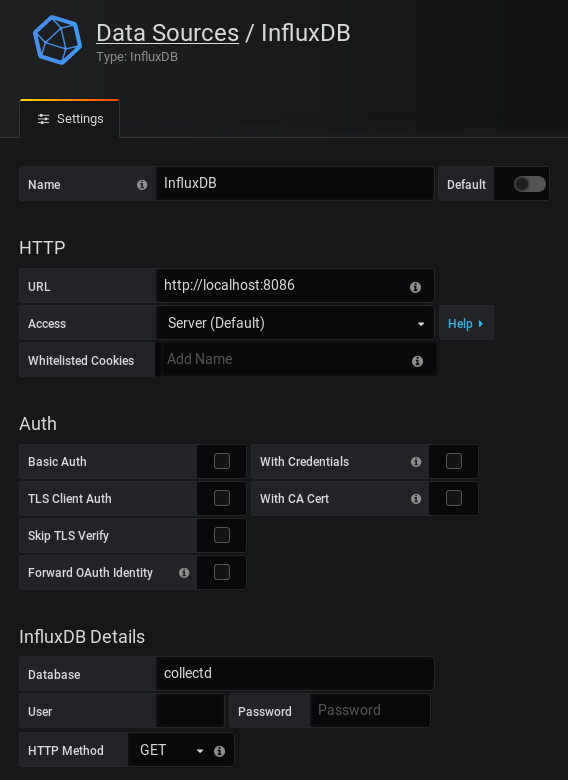
Now we can add our two data sources. First, Prometheus, poing to localhost on port 9090…

..and then InfluxDB, pointing to localhost on port 8086 and to the collectd database.
Adding a Grafana dashboard
Make sure they tested OK and we’re well on our way. Next we just need to create some dashboards, so let’s get a dashboard to show node exporter and we’ll hopefully at least see the monitoring host itself.
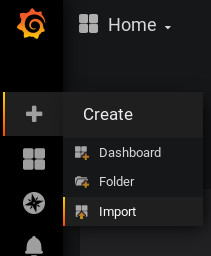
Go to Dashboards and hit import.
Type the number 1860 in the dashboard field and hit load.

This should automatically download and load the dash, all you need to do is select your Prometheus data source from the Prometheus drop down and hit Import!
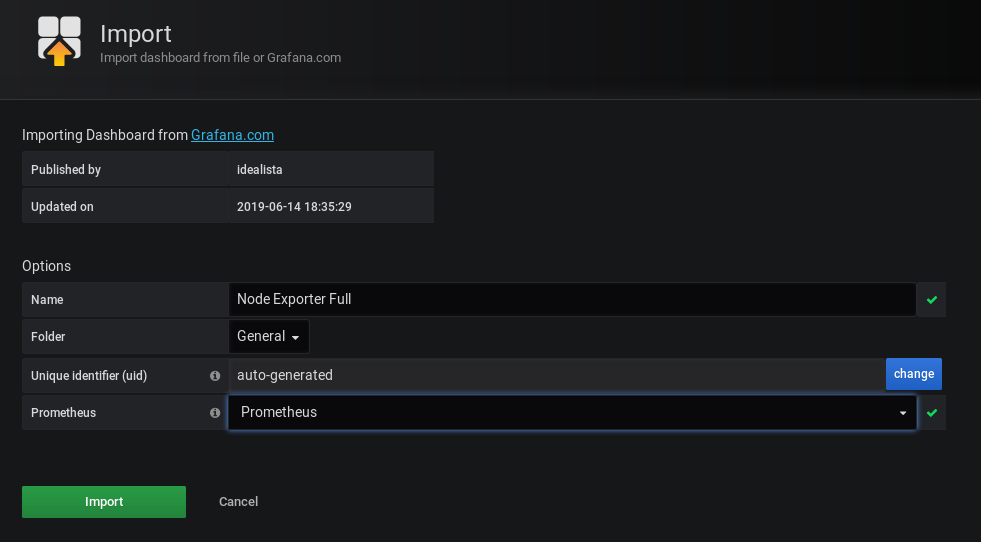
Next you should see the dashboard with metrics from your monitor node.
So there you go, you’re on your way to monitoring all the things! For anything that supports collectd, you can forward metrics to UDP port 25826 on your monitor node. More on that later…

5 thoughts on “Setting up a monitoring host with Prometheus, InfluxDB and Grafana”
For all of you guys – do not forget to remove the # infront of [[collectd]]
Thanks Chavdar, my `sed` command in there should have done that, maybe I need to double check it. Cheers.
Great post !
I also had trouble to get collectd plugin running correctly.
Finally I found my issue:
typesdb = “/usr/local/share/collectd”
requires the filename at the end *doh*.
so it should be
typesdb = “/usr/local/share/collectd/types.db”
That worked for me.
Cheers.
Thank you! I think it’s very helpful.
I understand that running node_exported as a privileged container instead of a simple application is advisable.
But, once you have set up your docker host, why don’t you run InfluxDB and Grafana as containers?
Yeah, yum was just easier at the time 🙂