In my previous blog post I showed how to set up InfluxDB and Grafana (and Prometheus), please see that post on how to configure them. This is how I configured my OpenWrt devices to provide monitoring and graphing of my network.
OpenWrt includes support for collectd (and even graphing inside Luci web interface) so we can leverage this and send our data across the network to the monitoring host.
Install and configure packages on OpenWrt
Log into your OpenWrt devices and install the required packages.
opkg update
opkg install luci-app-statistics collectd collectd-mod-cpu \
collectd-mod-interface collectd-mod-iwinfo \
collectd-mod-load collectd-mod-memory collectd-mod-network collectd-mod-uptime
/etc/init.d/luci_statistics enable
/etc/init.d/collectd enable
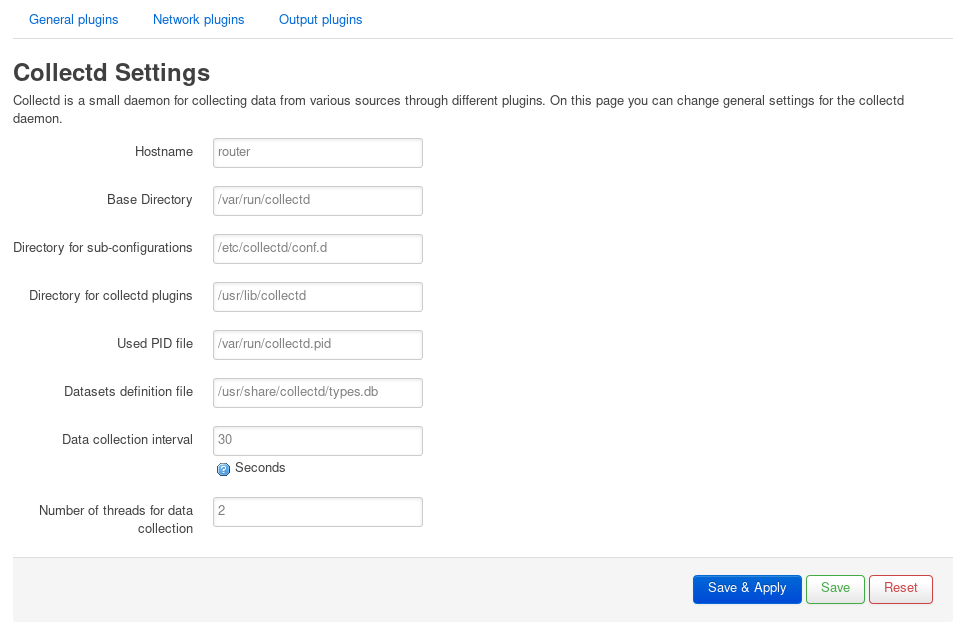
Next, log into your device’s OpenWrt web interface and you should see a new Statistics menu at the top. Hover over this and click on Setup so that we can configure collectd.
Add the Hostname field and enter in the device’s hostname (or some name you want).
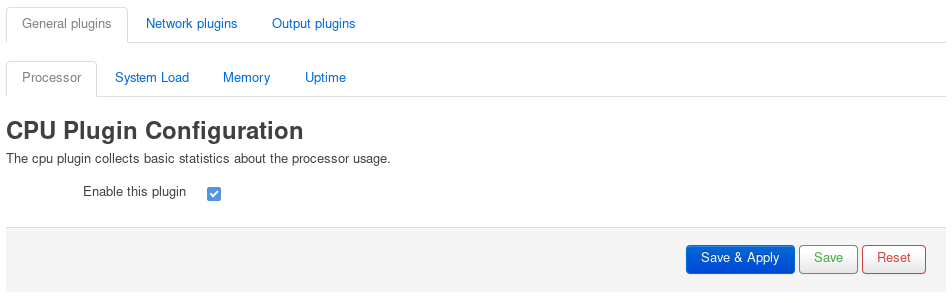
Click on General plugins and make sure that Processor, System Load, Memory and Uptime are all enabled. Hit Save & Apply.
Under Network plugins, ensure Interfaces is enabled and select the interfaces you want to monitor (lan, wan, wifi, etc).
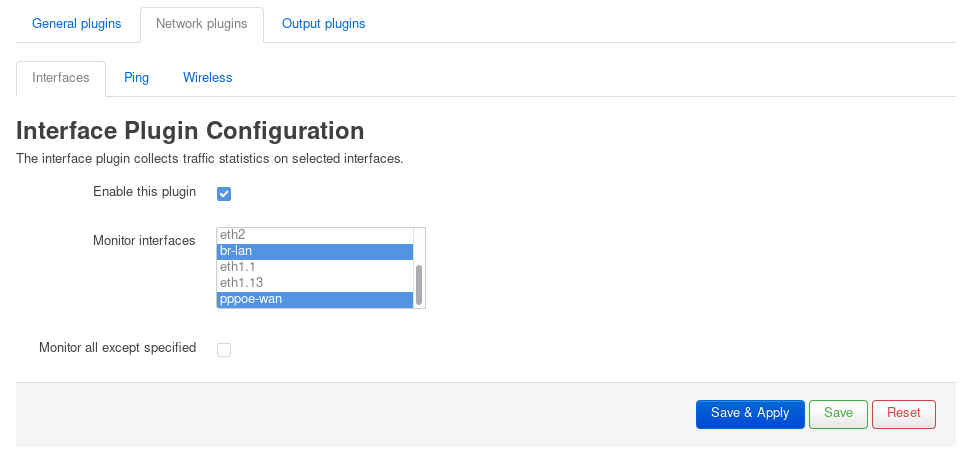
Still under Network plugins, also ensure Wireless is enabled but don’t select any interfaces (it will work it out). Hit Save & Apply (I don’t bother with the Ping plugin).

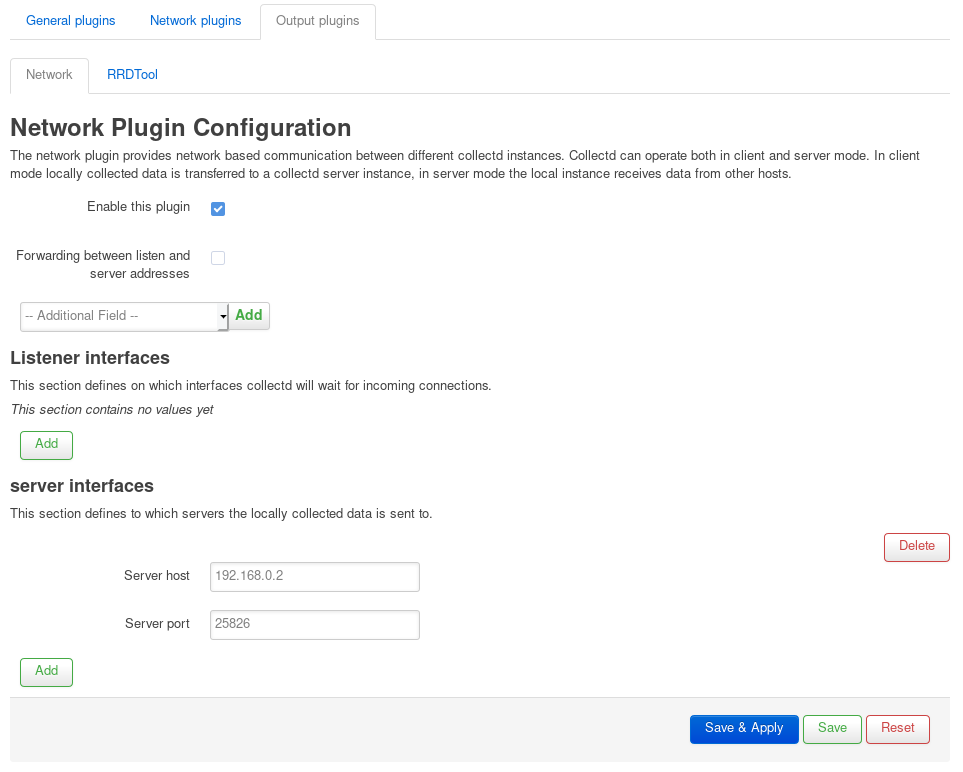
Click on Output plugins and ensure Network is enabled so that we can stream metrics to InfluxDB. All you need to do is add an entry under server interfaces that points to the IP address of your monitor server (which is running InfluxDB with the collectd listener enabled). Hit Save & Apply.
Finally, you can leave RRDTool plugin as it is, or disable it if you want to (it will stop showing graphs in Luci if you do, but we’re using Grafana anyway and you’ll have less load on your router). If you do enable, it make sure it is writing data to tmpfs to avoid wearing our your flash (this is the default configuration).
That’s your OpenWrt configuration done!
Loading a dashboard in Grafana
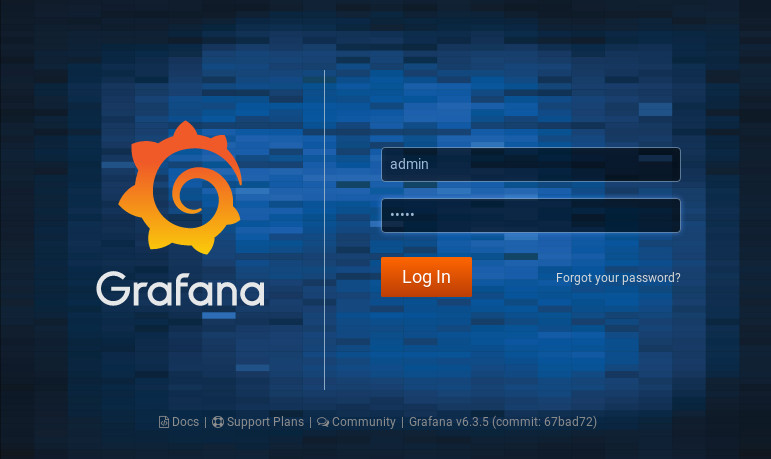
Still in your web browser, log into Grafana on your monitor node (port 3000 by default).
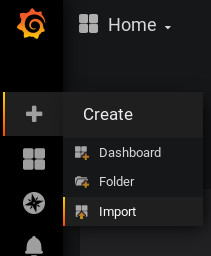
Import a new dashboard.
We will use an existing dashboard by contributor vooon341, so simply type in the number 3484 and hit Load.
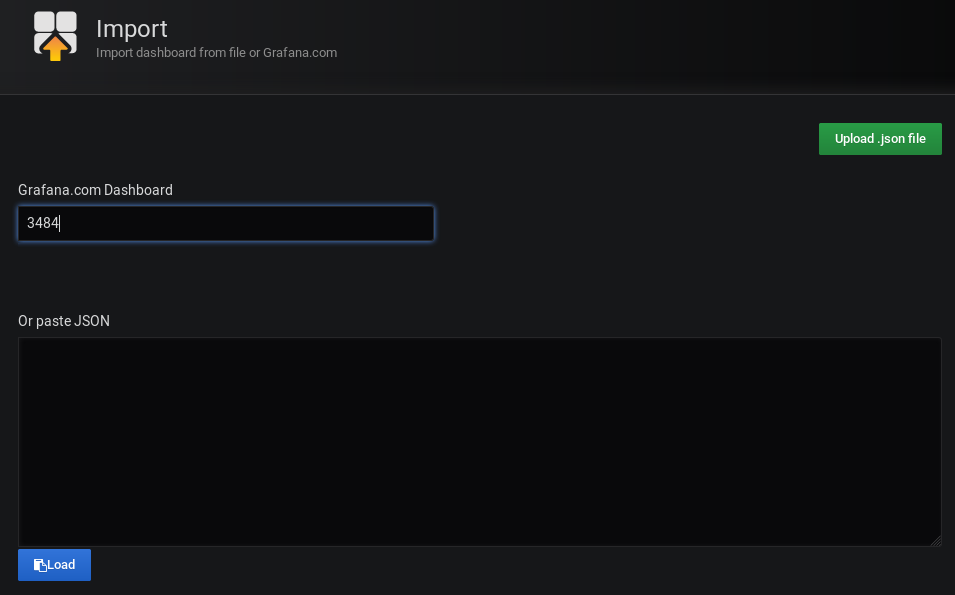
This will download the dashboard from Grafana and prompt for settings. Enter whatever Name you like, select InfluxDB as your data source (configured in the previous blog post), then hit Import.

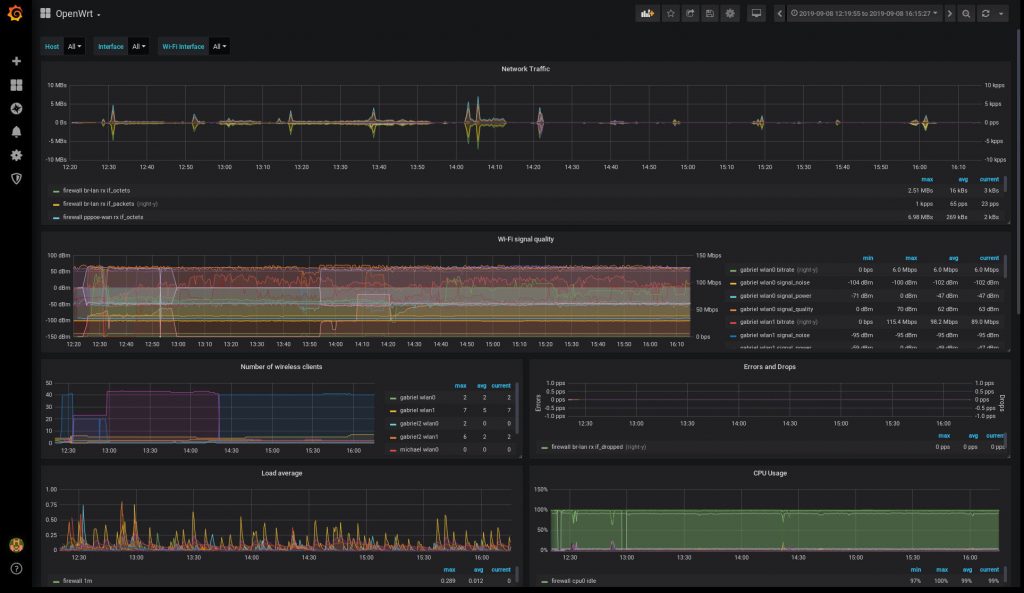
Grafana will now go and query InfluxDB and present your dashboard with all of your OpenWrt devices.

OpenWrt also supports a LUA Prometheus node exporter, so if you wanted to add those as well, you could. However, I think collectd does a reasonable job.

27 thoughts on “Monitoring OpenWrt with collectd, InfluxDB and Grafana”
Thanks for the great blog posts. I have followed both the “Monitoring host with Prometheus, Influxdb and Grafana” and “Monitoring OpenWrt with collectd, InfluxDB, and Grafana” posts. I was able to get the first one working and added all my hosts and everything seems to be working properly now. However, when I try to add my OpenWRT router, I can’t seem to get the metrics displayed on my Grafana dashboard. I have tried querying the Influxdb side and I can see that the metrics are getting there correctly, however they are not appearing on the grafana dashboard. Do you have any suggestions on how to troubleshoot the grafana dashboard?
Hey Carlos, OK so it sounds like your data is getting to Influxdb fine, so maybe this is an issue with Grafana talking to it. Are both services on the same node? What does your datasource look like for Influxdb? Is it pointing to the right IP and the right database?
Thanks! Great article and got it working. Had to configure influxdb with collectd listener and import types.db file to it. And on Grafana side you have to make sure that data source has right database selected.
I’m using TurrisOmnia router.
Excellent!
Hello, interesting article. I am something new in the subject but I have the case that I have three router with openwrt in different houses and I want to monitor from a single point the data collected by collectd in these three houses, in that case how would the configuration of the influex server and others be?
Ahh well I haven’t done that, but I guess you need a way to send that data to the central point, probably either be over a VPN or the Internet through your router. You would then set that public or VPN IP in the Output plugin under server interfaces, as per the blog post.
Hello,
Why my Wireless Clients and my OPVN stays empty? All other Diagrams fill up with Data, only the two still remain empty?
Can u help with it?
I’m not sure, do you have a screenshot?
Hi,
Thx a lot !!!!!
Same issue here: no WiFi client count, I haven’t any stations filter in my iwinfo_value query.
Any idea ? Best regards.
Hi,
Thx a lot for you article ! I can monitor all my OpenWRT on my home !
Juste an issue, I have no data for “Number of wireless client”. After analyse of the query, I haven’t any data for type “station”. Any idea ?
Best regards.
Fixed, you must take types.db from /usr/share/collectd/types.db and put it on your InfluxDB server. All is good now !
Yep, sorry. It’s covered in the linked blog post about setting those platforms up. Maybe I should add it to this one, too. Thanks.
Thanks Chris for the post and llaumgui with the last types.db tip.
Just copying this file to influxdb dir makes the number of wireless clients work like a charm!
Grafana dashboard for OpenWRT fully working now.
Great!
Just a note – the types is missing:
stations value:GAUGE:0:256
Thanks, I’ve added commands to add that when downloading the types file.
Hey Chris, this seems like a great article, Im following the steps but it looks like my influxdb is not listening to collectd.
I have tried to check everything but I cant get it working.
Im running a collectd server on a raspberry pi, getting collectd info from my router openwrt, it is working, I can see the connection and the data that collectd is saving, but im stuck there, influxdb is not getting anyinfo, grafana is ready reading influxdb but is the DB that is empty
Please can you give me a hint what else to try?
Hey Sebastian, have you followed the linked post about setting up influxdb etc? https://blog.christophersmart.com/2019/09/08/setting-up-a-monitoring-host-with-prometheus-influxdb-and-grafana/
I did, but I didnt use prometheus couse I understand its for local monitoring (it will be my raspi) and in fact im mainly looking for monitoring some routers only (for now). It can be done in this way or i must install Prometheus mandatory?
Thanks pr replying!
This is very helpful. Thank you for putting this together
Great, glad it was helpful!
If someone is having troubles showing the data (If no data is shown in grafana), check your influxdb version.
Version 1.6.4 dont show results, update to 1.8+
Hi
Are you able to get some stats per hots (=all devices connected to the router by name or IP), like traffic per host in real time?
Hi Pascal, I’m not sure sorry, my monitor machine got a corrupt drive and I need to rebuild it…
Hi Chris, given you are rebuilding your monitor machine, have you looked at how to use this on InfluxDB2? I have a server setup already, and it seems you have to use telegraph to convert the collectd output but information is scarce! Thanks.
Hey Jason, I haven’t had time to rebuild it yet, but when I do I’ll see if I can look into this..
If your OpenWrt router doesn’t have any Wi-Fi devices the host list is incomplete, this can be fixed by changing the query for the host list to e.g. SHOW TAG VALUES FROM “interface_rx” WITH KEY=host